
Why Is Cash Flow Still Tight? The Profit Metrics D2C Brands Miss
ROAS Is 5X—So Why Is Cash Flow Still Tight? The Profit Metrics D2C Brands Miss is a business problem before it is a marketing problem. Teams usually notice it after a dashboard looks better than the bank account: traffic rises, clicks get cheaper, leads increase or ROAS appears healthy, yet qualified pipeline and revenue do not improve at the same pace. That is exactly where a disciplined roas vs profit d2c review becomes useful. The aim is not to chase a prettier marketing metric. The aim is to find the stage where value is leaking and fix that stage before spending more.
For SocioLabs clients and similar growth-focused businesses, the practical rule is simple: diagnose the funnel in the same order a customer experiences it. Start with intent and measurement, then examine the page or offer, then qualification, follow-up and revenue. This article gives you a framework you can use in an internal review, an agency discussion or a campaign audit without relying on vague advice.
Roas vs Profit d2c
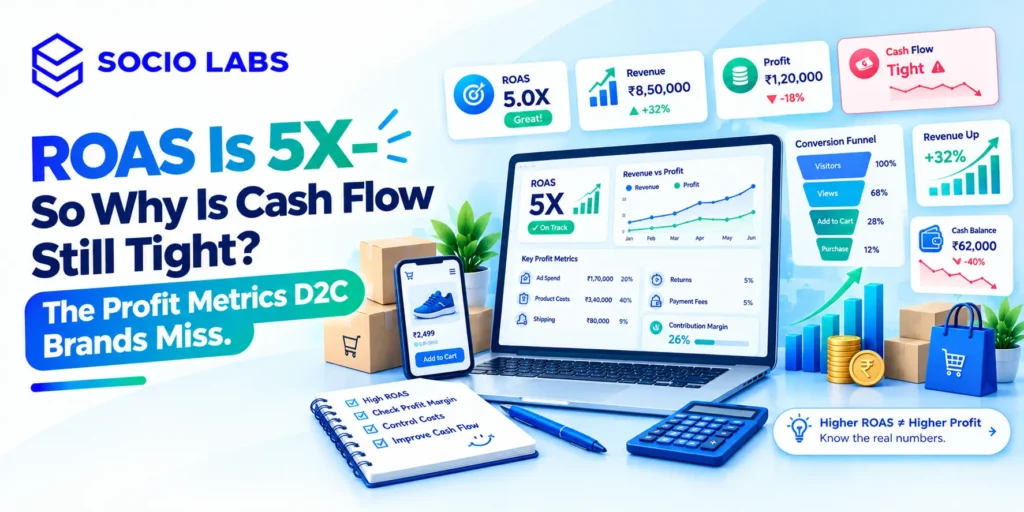
A 5X ROAS can still produce weak cash flow because ROAS ignores product margin, discounts, shipping, returns, payment fees, agency costs and repeat-purchase timing. D2C brands should manage paid growth using contribution margin, CAC, payback period, blended efficiency and cash conversion not platform ROAS alone.
Why roas vs profit d2c becomes a revenue problem
Platform ROAS answers a narrow question: how much attributed revenue did the ad platform report for each rupee of media spend? It does not answer whether the order left enough money after variable costs to fund the next cycle of growth.
The mistake is to react to the first visible symptom. A weak headline can look like a traffic problem; poor targeting can look like a landing-page problem; slow sales follow-up can look like a lead-quality problem. Good diagnosis separates symptoms from causes. That matters because every wrong fix has an opportunity cost: redesigning a page that was never the bottleneck, increasing bids when tracking is broken, or cutting a channel that was generating strong assisted demand.
How to diagnose roas vs profit d2c step by step
1. Revenue is not contribution
A high order value can look impressive while COGS and fulfilment consume most of it. Calculate contribution margin after product, payment, shipping and variable fulfilment costs.
2. Discounts inflate attributed revenue but compress margin
Aggressive offers can improve conversion rate and ROAS while reducing cash generated per order. Report net revenue after discounts and returns alongside platform revenue.
3. Returns and cancellations arrive later
The dashboard may celebrate revenue that never becomes collected cash. Use realised revenue and cohort-level return rates in profitability reviews.
4. New-customer CAC is hidden inside blended results
Retargeting can make account ROAS look strong while prospecting is unprofitable. Separate acquisition efficiency from repeat and retargeting revenue.
5. Agency and creative costs are excluded
Media efficiency alone does not represent total acquisition cost. Add management, creative production, tools and influencer support to fully loaded CAC.
6. Cash conversion timing matters
Inventory may be paid for weeks before a customer order returns cash. Track payback period and working-capital pressure by cohort.
7. LTV assumptions are too optimistic
Projected repeat purchase can justify losses that never recover. Use realised 60-, 90- and 180-day cohort revenue rather than a theoretical lifetime value.
8. Channel attribution double-counts revenue
Meta, Google and analytics may all claim the same purchase. Use blended business metrics such as MER and finance-reconciled revenue for executive decisions.
Metrics that should be on the same page
A useful dashboard does not need dozens of widgets. It needs a small set of connected numbers that show whether the system is attracting the right people, converting them, qualifying them and turning them into economic value. For this topic, keep the following measures visible together:
- Contribution margin after marketing
- Fully loaded cac
- Cac payback period
- Blended mer
- Net revenue after returns
- 90-day cohort ltv
The focus keyword roas vs profit d2c should never be evaluated from a single platform report. Where possible, reconcile ad or analytics data with CRM, ecommerce or finance outcomes. That is how you avoid optimising a proxy while the real business result moves in the opposite direction.
A practical decision framework for roas vs profit d2c
Signal you see | Most likely area to inspect first | What to do next |
Volume is weak but downstream conversion is healthy | Traffic / reach / demand capture | Improve targeting, visibility or budget only after tracking is verified |
Traffic is healthy but leads are weak | Offer / page / CTA / trust | Run a focused CRO or message-match review |
Leads are high but sales rejects them | Intent / qualification / targeting | Optimise toward qualified outcomes and feed rejection data back |
Qualified leads are healthy but revenue is weak | Sales process / pricing / follow-up | Audit response time, discovery, proposal and close-rate stages |
Reports disagree with reality | Tracking / attribution / CRM | Fix measurement before scaling or cutting spend |
How to make this article and strategy AI-search friendly
For Google and AI answer engines, lead with a clear definition, use direct answers, descriptive H2/H3s, tables, FAQs, original examples and contextual internal links. Keep claims specific and verifiable. Use Article and BreadcrumbList schema, and FAQPage only when the visible FAQs remain on the page. Do not repeat roas vs profit d2c unnaturally.
What to do this week
Start with a 30–60 minute review. Pull a meaningful period of traffic, lead, sales and revenue data, mark where the funnel first diverges from target, and choose one corrective action. Define the metric that should move if the diagnosis is right and avoid changing every variable at once.
Conclusion
The core lesson is to stop treating roas vs profit d2c as an isolated metric. Marketing creates value through a chain: relevant demand, clear message, conversion, qualification and profitable revenue. Diagnose the chain, fix the first proven leak and then scale what works.
FAQs
It means evaluating the marketing activity against the business outcome it is supposed to create, then identifying the first stage where performance drops. The exact metric changes by business model, but the method is the same: verify measurement, inspect intent and conversion, then check qualification and revenue.
Fix the earliest confirmed bottleneck, not the loudest symptom. If tracking is wrong, repair tracking first. If traffic quality is poor, fix targeting before redesigning the website. If qualified leads are strong but revenue is weak, the priority is usually sales execution or economics.
Use enough data to see a repeated pattern across the normal buying cycle. High-volume ecommerce may produce signal quickly; high-ticket B2B can need weeks because conversions and revenue arrive later. Use stop-loss rules, but avoid declaring failure from a tiny sample.
Use leads as a useful intermediate signal, but optimise the system toward the deepest reliable outcome you can measure. That may be qualified lead, booked meeting, purchase, contribution margin or closed revenue depending on the business.
Sometimes, but not always. Marketing performance crosses targeting, website experience, tracking, CRM and sales follow-up. The best results usually come when ownership is clear and each team fixes the part of the funnel it controls.